The Elastic Stack is a popular open source log management platform that can be used to consume Forum Sentry logs sent via Remote Syslog policies. This (free) tool can be useful for:
1. Log aggregation across multiple Sentry instances - search one location for runtime events across any number of Sentry instances.
2. Dashboards for monitoring Sentry policies - status codes, services invoked, auth failures, potential attacks, etc.
3. Generating reports and alerts based on Sentry log messages - parse Audit, System, and Access logs in real time for reporting and alerting through Kibana.
Important Notes
This article includes instructions for integrating Forum Sentry with the Elastic Stack via remote syslog policies in Sentry.
Included are sample Grok patterns to parse the Sentry Access log syslog output with Logstash along with a sample Kibana dashboard with associated visualizations built for the sample Grok patterns.
This article does not cover the set up and installation of the Elastic Stack, which is well documented here.
Forum Systems Support is not able to troubleshoot or assist with the configuration of the Elastic Stack. For questions on these products, please check the Elastic Community.
This article and the attached samples have been confirmed to work with a locally installed Elastic Stack deployment with v5.5.1 of the Elastic products.
Configuration
There are 3 simple steps to configuring the Forum Sentry / Elastic Stack integration.
I. Install and Configure Logstash, Elasticsearch, and Kibana
1. Follow the Elastic documentation for installing Logstash, Elasticsearch and Kibana.
2. Once installed, run Logstash with a configuration file that includes a TCP input on port 514 with the sample Grok patterns. A sample Logstash configuration file with the sample Grok patterns is included below and also attached.
Figure 1: Sample Logstash config file with TCP input on 514 for syslog and sample Grok Patterns
input {
tcp {
port => 514
type => syslog
}
udp {
port => 514
type => syslog
}
}
filter {
grok {
match => { "message" =>"%{SYSLOG5424PRI}1 %{MCOLLECTIVEAUDIT}%{JAVACLASS}%{ISO8601_TIMEZONE} %{IP} ForumSystemsSentry - 08409 %{SYSLOG5424SD} %{WORD:logID} %{WORD:transact
ionID} %{NUMBER}%{DATA}%{IP:clientIP} %{WORD:httpMethod} %{URIPATH:serviceURL} HTTP/1.1 %{NUMBER:statusCode} %{NUMBER:length} %{IP:listenerIP}:%{NUMBER:listenerPort} %{NUMBER:
startTime} %{NUMBER:endTime} %{NUMBER:totalTimeMS}%{GREEDYDATA:custom}" }
}
}
output {
elasticsearch { hosts => ["localhost:9200"] }
stdout { codec => rubydebug }
}
3. In the Kibana interface, import the attached Saved Objects (FS_ELK_Full_Export.json) on the Management --> Saved Objects page. This will import the following objects:
1 Dashboard
3 Searches
6 Visualizations
Figure 2: Importing Saved Objects into Kibana for sample Visualizations and a Dashboard that map to the sample Grok patterns provided

II. Configure Forum Sentry Syslog Policies
Create a Remote Syslog policy to align with the Logstash TCP input detailed in the Logstash configuration file. The Syslog policy in Sentry should only have one log included, the Access log, with all log levels enabled.
Use the parameters shown in the screen shot below, replacing the Server value with the IP of your Logstash server.
Figure 3: Configuring a Remote Syslog policy in Forum Sentry

III. Test the Configuration
Send runtime traffic through your Forum Sentry instance. Test multiple services, test from different clients, test using different HTTP methods, etc.
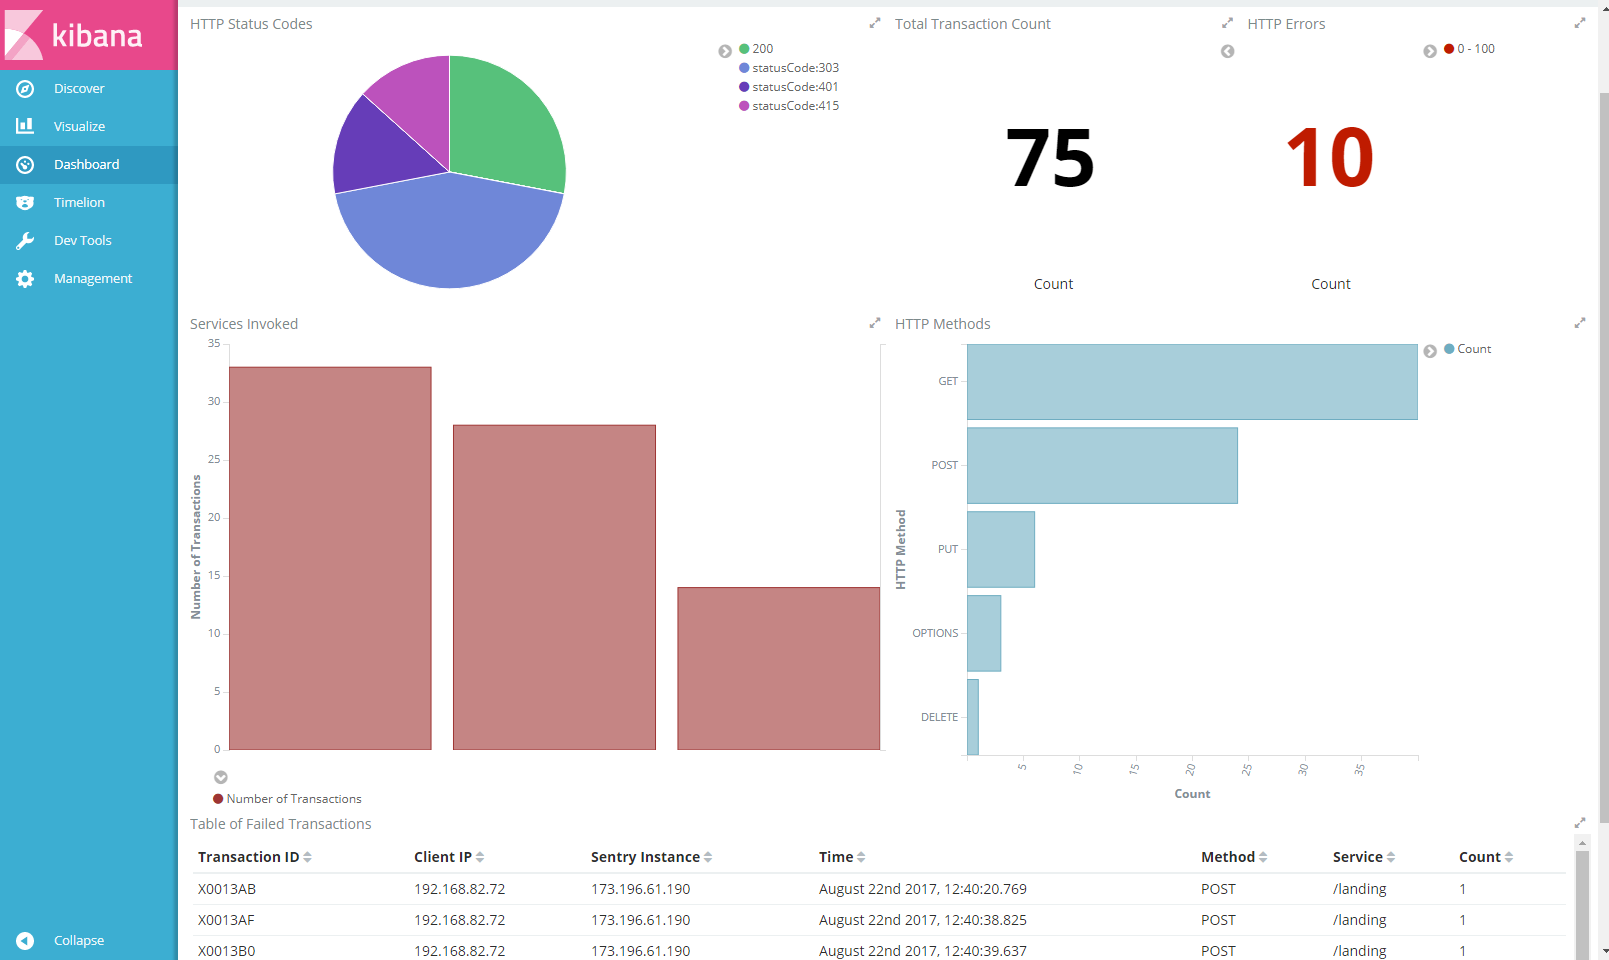
Open the FS Sentry Dashboard in Kibana and the various graphs should start showing data.
Figure 4: The sample Kibana Dashboard displaying Visualizations built from the sample Grok patterns applied to Sentry Access Log messages

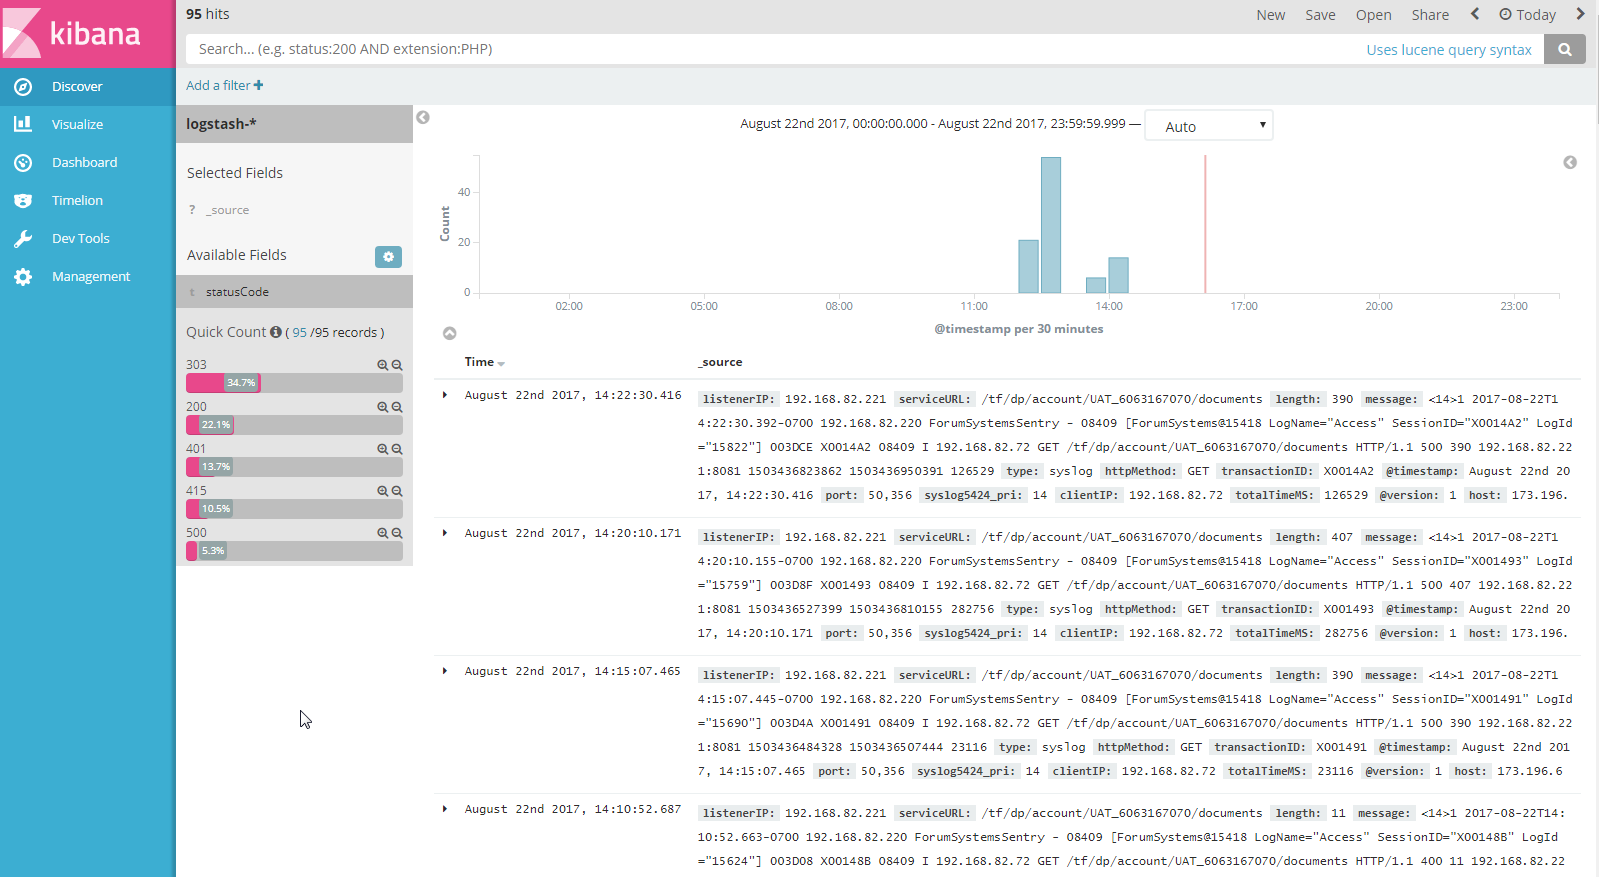
You should also search the raw syslog data on the Discover page.
When viewing the filtered logs for the Sentry input, there should be Sentry Access Log specific fields on the left that align with the Grok patterns in the Logstash configuration. These fields can be used for further filtering. Fields will include: serviceURL, statusCode, transactionID, logID, totalTimeMS and others.
Figure 5: The Kibana Discover page showing a Quick Count for HTTP Status codes as derived from Sentry Access log messages

Next Steps
- Create meaningful graphs and tables for your specific services for the Dashboard
- Create a new Syslog policy for the Sentry System log (be mindful of sensitive data being sent) - consider using a separate input with specific Grok patterns for specific System log messages
- Create a new Syslog policy for the Sentry Audit log
Related
Attached are the latest logging / reporting guides for reference. Linked below is a related KB article.
Best Practices: Important Log Messages

0 Comments