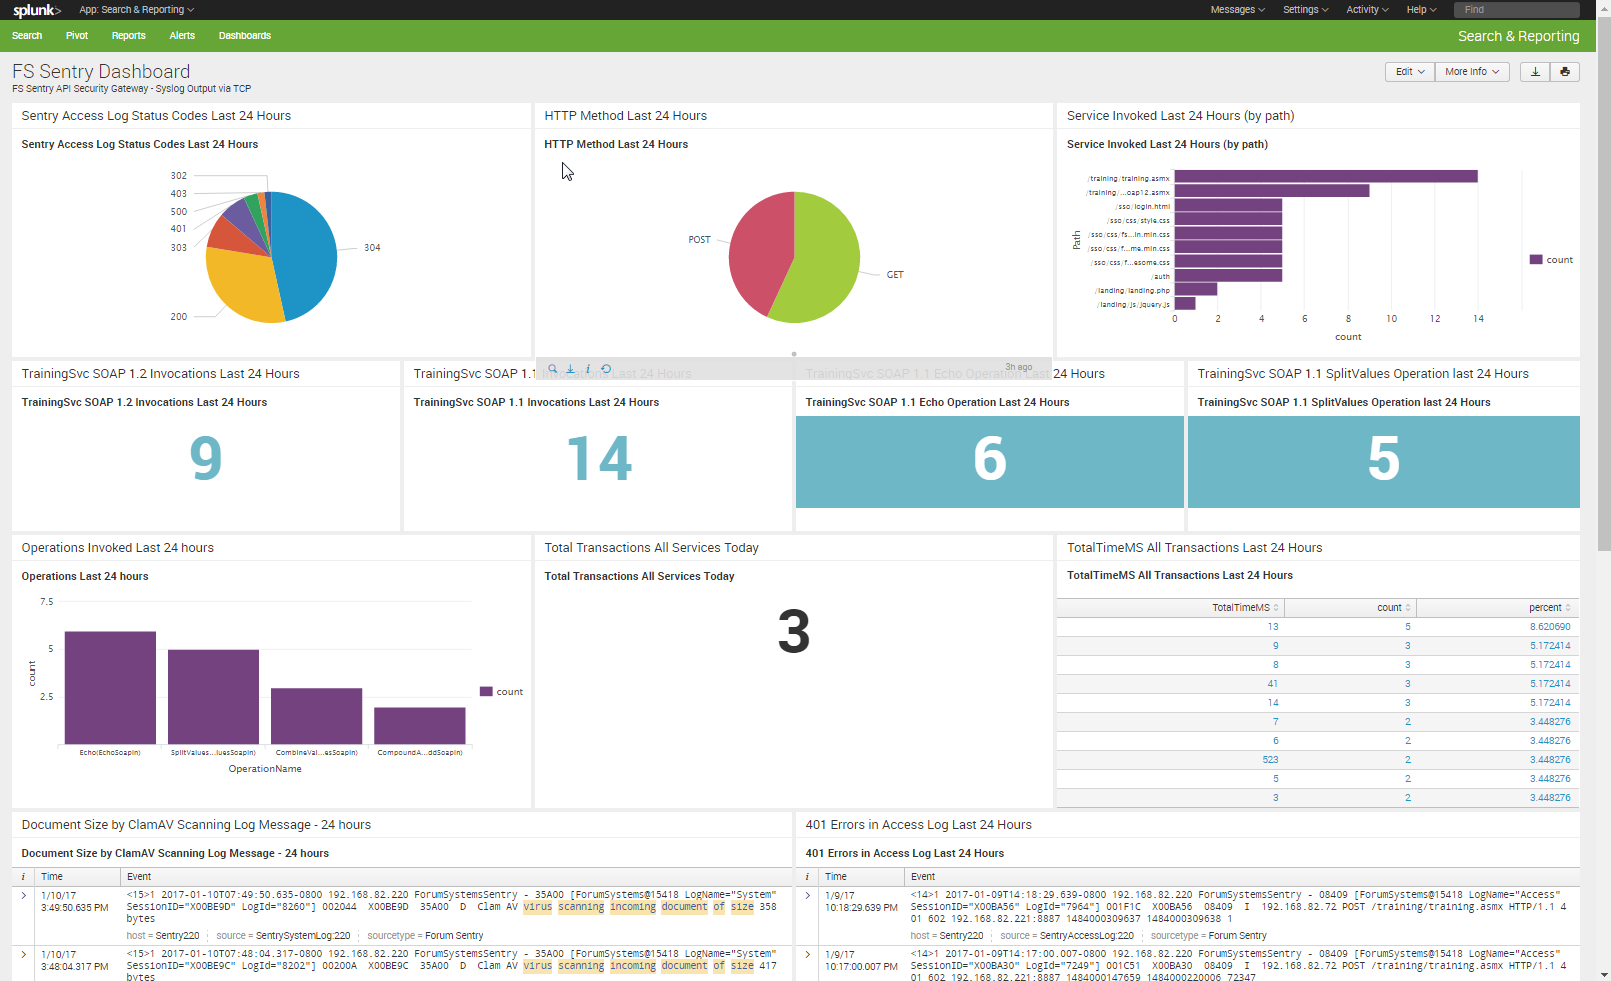
This article includes a sample Splunk Dashboard XML source document. Please note that this template is being provided as a sample only. Forum Systems Support is not responsible for troubleshooting or configuring Splunk. For questions on the Splunk product, please contact Splunk Support.
There are a 4 steps to use this template Splunk Dashboard with Sentry, each outlined below.
I. Import the Dashboard into Splunk
- Create new Dashboard in Splunk (you can use a temporary name and description as this will be replaced)
- When viewing the Dashboard, choose Edit>>Edit Source
- Copy / Paste the attached XML into the XML field
- Click Save
- The Dashboard name and description will change, and several Panels will be displayed within the Dashboard
II. Configure Splunk Data Inputs
Splunk will need to be configured with the Data Inputs to receive the Syslog output from Sentry. For this template Dashboard, you'll want to build 3 Data Inputs
a. TCP - Port 514 - SentryAccessLog
b. TCP - Port 515 - SentrySystemLog
c. TCP - Port 516 - SentryAuditLog
III. Configure Forum Sentry Syslog Policies
Create 3 Remote Syslog policies to align with the 3 Data Inputs created in Splunk. Use RFC 5424 format. Each Syslog policy in Sentry should only have 1 log enabled, matching the Data Input in Splunk. Enable all log levels for the log selected in each policy.
a. TCP - Port 514 - Sentry Access Logs Only
b. TCP - Port 515 - Sentry System Logs Only
c. TCP - Port 516 - Sentry Audit Logs Only
IV. Populate Splunk with Data and Extract New Fields from Template Search Results
1. Send runtime transactions through Sentry and then log into the WebAdmin interface. This will populate the Splunk database with syslog messages for all 3 log types.
2. Extract Fields for the Access Log - There is only 1 entry for each Access Log message.
a. Use the Splunk Search to find an Access Log transaction, it should look similar to the event below
<14>1 2016-08-19T13:12:21.511-0700 192.168.82.220 ForumSystemsSentry - 08409 [ForumSystems@15418 LogName="Access" SessionID="X011424" LogId="216336"] 034D10 X011424 08409 I 192.168.82.72 POST /training/training.soap12.asmx HTTP/1.1 200 336 192.168.82.221 1471637540689 1471637541510 821
b. Use the Extract New Fields option in Splunk, using the Access Log message as the sample
c. Use a space as the Delimiter to break the sample log message into fields
d. Set the following field names for use with this template Dashboard search strings
i. field8 = LogName
ii. field20 = Method
iii. field21 = Path
iv. field23 = StatusCode
v. field28 = TotalTimeMS
e. Set other field names as desired, these will be used in the Splunk search strings which are the basis for the Dashboard panels.
3. Extract Fields for the System and Audit Logs - using the Splunk Search, view various System and Audit log messages and extract fields from the samples as required for your reporting and alerting scenarios.
Important Note - The attached template Dashboard includes 1 Dashboard panel that references a custom field "OperationName" generated from the following sample System log entry:
<15>1 2016-08-19T13:45:46.273-0700 192.168.82.220 ForumSystemsSentry - 0E207 [ForumSystems@15418 LogName="System" SessionID="X015DCB" LogId="504161"] 07B161 X015DCB 0E207 D Matched WSDL operation 'SplitValues(SplitValuesSoapIn)'
After following the steps above, the template Dashboard panels should display data based on the Sentry syslog output.
The screenshot below shows an customized example of this sample Sentry Dashboard for Splunk.

Also attached are the latest logging / reporting guide for reference. Linked below is a related KB article.
Best Practices: Important Log Messages

0 Comments